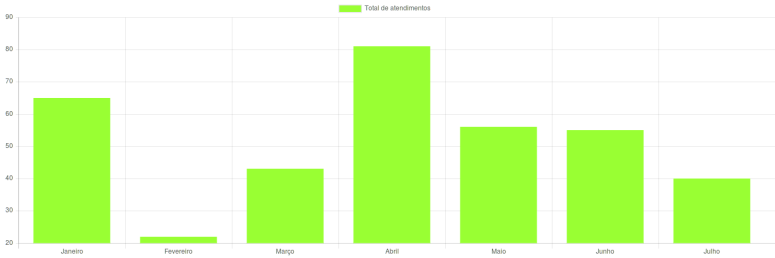
Exemplo 1 – Gráfico de barras
<!DOCTYPE html>
<html lang="en">
<head>
    <meta charset="utf-8" />
    <title>Chart.js - demonstração</title>
    http://ajax.googleapis.com/ajax/libs/jquery/1.12.4/jquery.min.js
    http://cdnjs.cloudflare.com/ajax/libs/Chart.js/2.1.4/Chart.min.js
</head>
<body>
    <canvas id="myChart" width="600" height="200"></canvas>

    var ctx = $("#myChart");

    var myChart = new Chart(ctx, {
        type: "bar",
        data: {
            labels: ["Janeiro", "Fevereiro", "Março", "Abril", "Maio", "Junho", "Julho"],
            datasets: [{
                label: "Total de atendimentos",
                fillColor: "rgba(220,220,220,0.2)",
                strokeColor: "rgba(220,220,220,1)",
                backgroundColor: "rgba(153,255,51,1)",
                data: [65, 22, 43, 81, 56, 55, 40]
            }]
        }
    });

</body>
</html>
Gráfico
